sklearn.neighbors.kneighbors_graph#
- sklearn.neighbors.kneighbors_graph(X, n_neighbors, *, mode='connectivity', metric='minkowski', p=2, metric_params=None, include_self=False, n_jobs=None)[source]#
Compute the (weighted) graph of k-Neighbors for points in X.
Read more in the User Guide.
- Parameters:
- Xarray-like of shape (n_samples, n_features)
Sample data.
- n_neighborsint
Number of neighbors for each sample.
- mode{‘connectivity’, ‘distance’}, default=’connectivity’
Type of returned matrix: ‘connectivity’ will return the connectivity matrix with ones and zeros, and ‘distance’ will return the distances between neighbors according to the given metric.
- metricstr, default=’minkowski’
Metric to use for distance computation. Default is “minkowski”, which results in the standard Euclidean distance when p = 2. See the documentation of scipy.spatial.distance and the metrics listed in
distance_metricsfor valid metric values.- pfloat, default=2
Power parameter for the Minkowski metric. When p = 1, this is equivalent to using manhattan_distance (l1), and euclidean_distance (l2) for p = 2. For arbitrary p, minkowski_distance (l_p) is used. This parameter is expected to be positive.
- metric_paramsdict, default=None
Additional keyword arguments for the metric function.
- include_selfbool or ‘auto’, default=False
Whether or not to mark each sample as the first nearest neighbor to itself. If ‘auto’, then True is used for mode=’connectivity’ and False for mode=’distance’.
- n_jobsint, default=None
The number of parallel jobs to run for neighbors search.
Nonemeans 1 unless in ajoblib.parallel_backendcontext.-1means using all processors. See Glossary for more details.
- Returns:
- Asparse matrix of shape (n_samples, n_samples)
Graph where A[i, j] is assigned the weight of edge that connects i to j. The matrix is of CSR format.
See also
radius_neighbors_graphCompute the (weighted) graph of Neighbors for points in X.
Examples
>>> X = [[0], [3], [1]]
>>> from sklearn.neighbors import kneighbors_graph
>>> A = kneighbors_graph(X, 2, mode='connectivity', include_self=True)
>>> A.toarray()
array([[1., 0., 1.],
       [0., 1., 1.],
       [1., 0., 1.]])
Examples using sklearn.neighbors.kneighbors_graph#

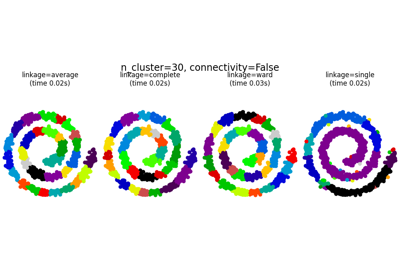
Agglomerative clustering with and without structure

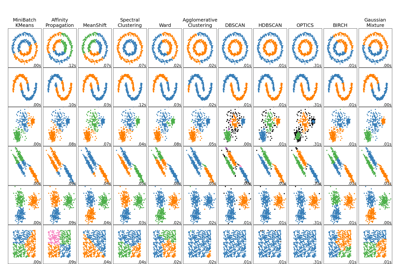
Comparing different clustering algorithms on toy datasets

Hierarchical clustering: structured vs unstructured ward
